


Introduction
Shared micro-mobility has gained increasing popularity in recent years. This new transportation (including bikes and scooters, etc.) is convenient, fun, healthy, and good for the environment. According to a study from the National Renewable Energy Laboratory in 2021, high adoption of shared micro-mobility can save 2.3 billion gasoline-equivalent gallons per year nationwide [1]. The US micro-mobility market size was at 192 million USD in 2021 and is expected to surpass 217 million USD by 2025 [2].
Seven years after its May 2013 launch in New York City, Citi Bike, the nation’s biggest bike share system, reached the milestone of 100 millionth trip in 2020 [3]. The system had expanded across the Hudson River to Jersey City in 2015 and Hoboken in 2021. Now Jersey City and Hoboken (hereafter referred to as JC&H) Citi Bike system has over 80 docking stations and 800 bikes [4]. Each of the bikes in the New Jersey system is used 2.2 times, and each station is used 22 times on average each day. NYC’s bikes do get more use, with an average use of 4.4 times per bike and 65 times per station every day [5]. That indicates that the JC&H Citi Bike system has not reached its full potential yet.

Objective
The objective of the project is to extract insights from Jersey City and Hoboken (JC&H) Citi Bike trip history data to, firstly, help Citi Bike operators operate the system more smoothly and increase its growth. Secondly, actionable items summarized from the dataset can help to bring larger populations on bikes for an enjoyable casual ride or affordable commute.
Data Overview
The main dataset used for this analysis is Citi Bike System Data, which is hosted in an Amazon S3 Bucket [6]. Monthly trip data is consolidated in separate csv files; a total of 76 csv files were downloaded for the analysis. The downloaded trip history data covers from September 2015 to December 2021. The dataset has multiple variables, including trip time, start and end station names, user type, gender, etc. The entire dataset for analysis has over 2.3 million rows.
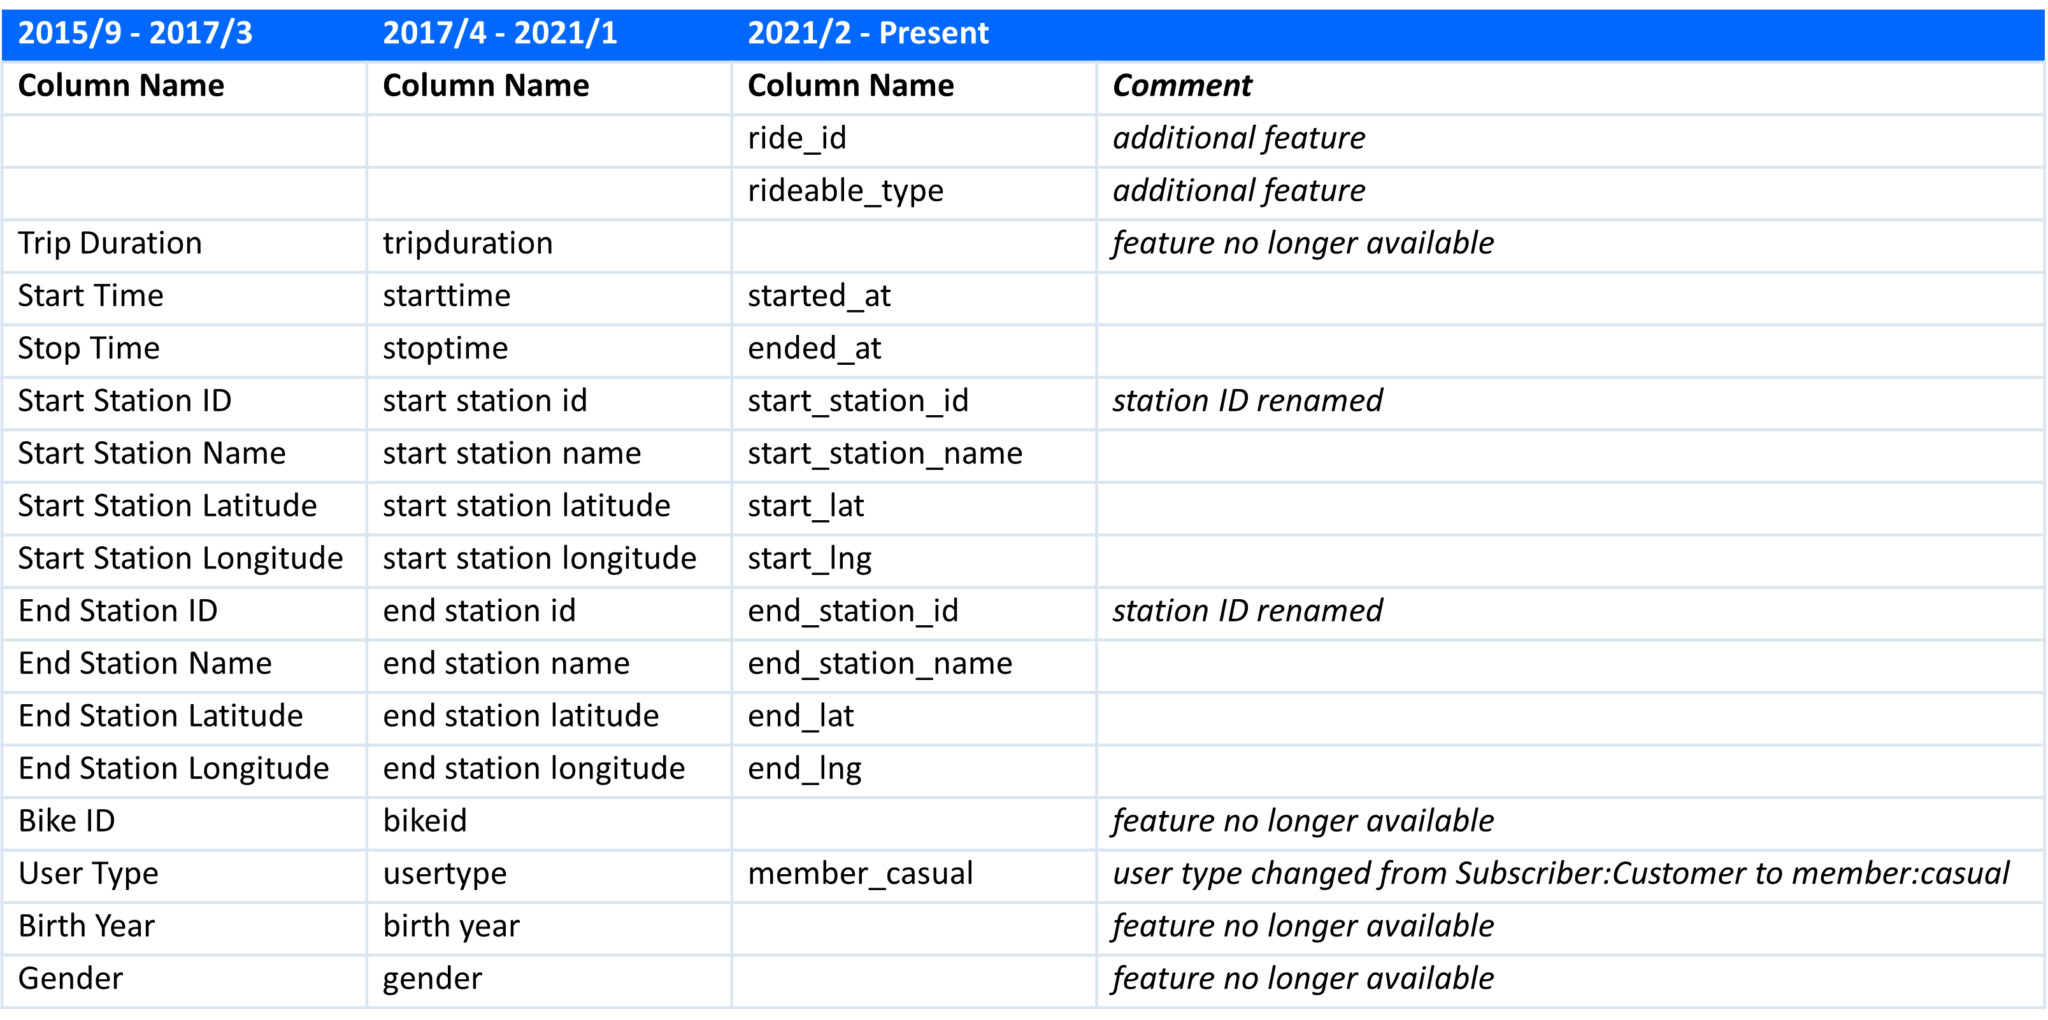
The data analysis was mainly done by using Python’s popular libraries, NumPy and Pandas, and visualization libraries such as Seaborn and Plotly. Functions were created to change data type, add additional features, and combine separate files by iterating through each csv file. It is worth noting that feature availability, column names, station ID, and membership categories changed over time. The table below summarizes the change. The dataset is overall clean. It is, however, missing some points of data, most of which is from 2021 where end station information is missing from about 0.5% of the observations. My first suggestion to the Citi Bike operator is: please spend a little more effort in data maintenance to keep it at the same level as it was prior to 2021. Concerning multiple useful features are no longer available from 2021, 2015-2020 data will be my main focus for insight extraction and 2021 data for projection of future trends.
Data Analysis
1. Make Biking more Female-friendly
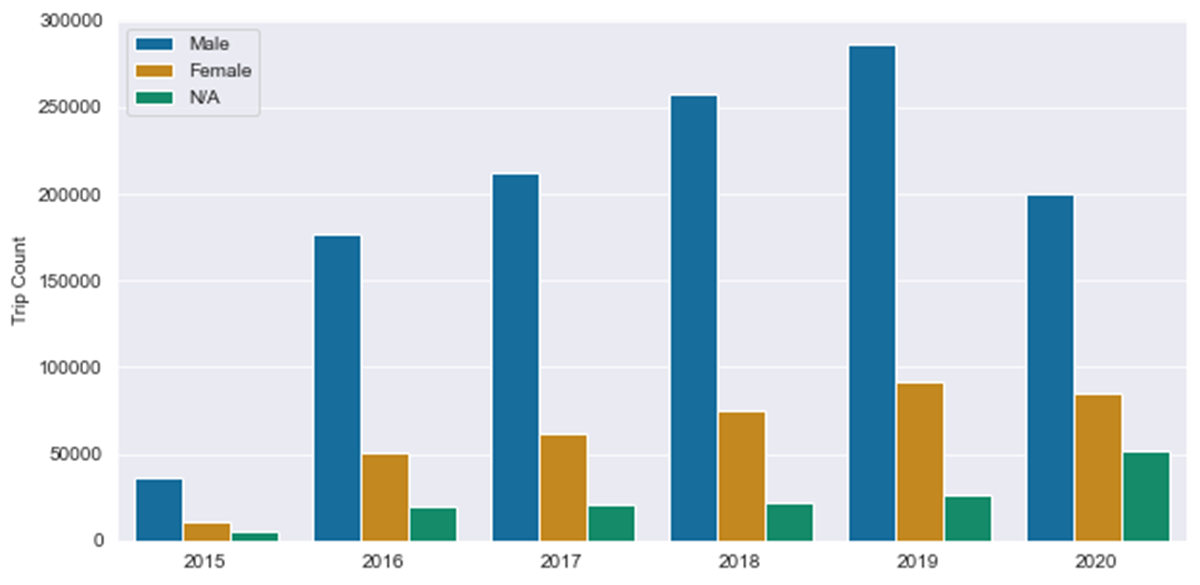
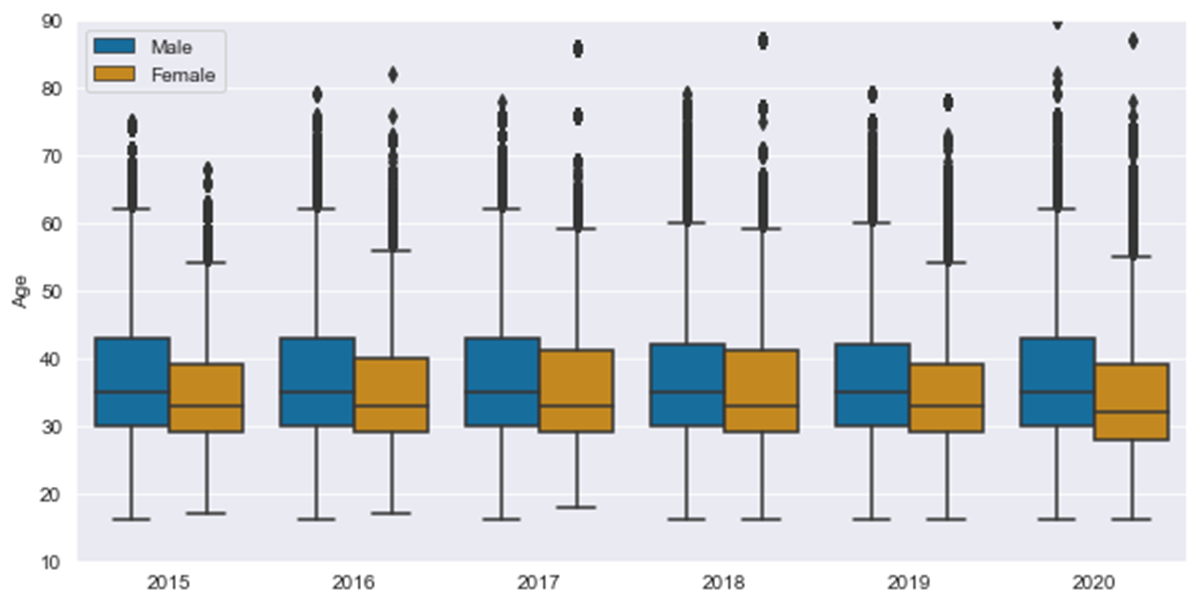
The breakdown by gender and age reveals that riders are predominantly male and that they are older overall than the female riders. Some efforts shall be taken to accommodate females or users with variable physical capability. Though nationwide men take twice as many cycling trips as women, females are the key to getting more people on to bikes [7]. Currently, Citi Bike offers bikes in just one size. Despite having adjustable seat height, the bike is still too high for some users and cumbersome to operate, raising safety concerns. Some complaints online and my own experience suggest Citi Bike should consider adding bikes in a smaller size.
“So many more male users!”
“Female users are younger!”
2. Embrace the New Normal
In early 2020, concerns about COVID-19 and stay-at-home orders caused Citi Bike trips to fall. However, the usage recovered quickly, and an evolved mixture of user types emerged since 2020. After members cut back on trips in 2020 mainly on weekdays, they came back in 2021, and trips rose slightly above their 2019 level. Interestingly, trips by non-members on both weekdays and weekends skyrocketed since 2020. Is it an era of non-member users? We should have a deeper analysis focusing on this group.
“So many more casual users!”


2.a. When do casual users ride?
While members still bike a lot on weekdays during the morning and afternoon rush hours, casual users revealed a different usage pattern in 2021. So, let’s see which stations are casual users’ favorites. A favorite station is defined as having the most average daily usage (by either taking or receiving a bike) during its life in commission. Because not all stations were put into commission at the same time, life in use needs to be considered.
“Casual users like weekends but not morning!”


Top 10 Stations by Casual Users
Most popular stations overlap between weekends and weekdays. These stations are generally close to parks and scenic areas like roads by the river. Special campaigns or discounts can be considered for these stations to promote Citi Bike and a healthy lifestyle among casual users.

2.b. How long do casual users ride?
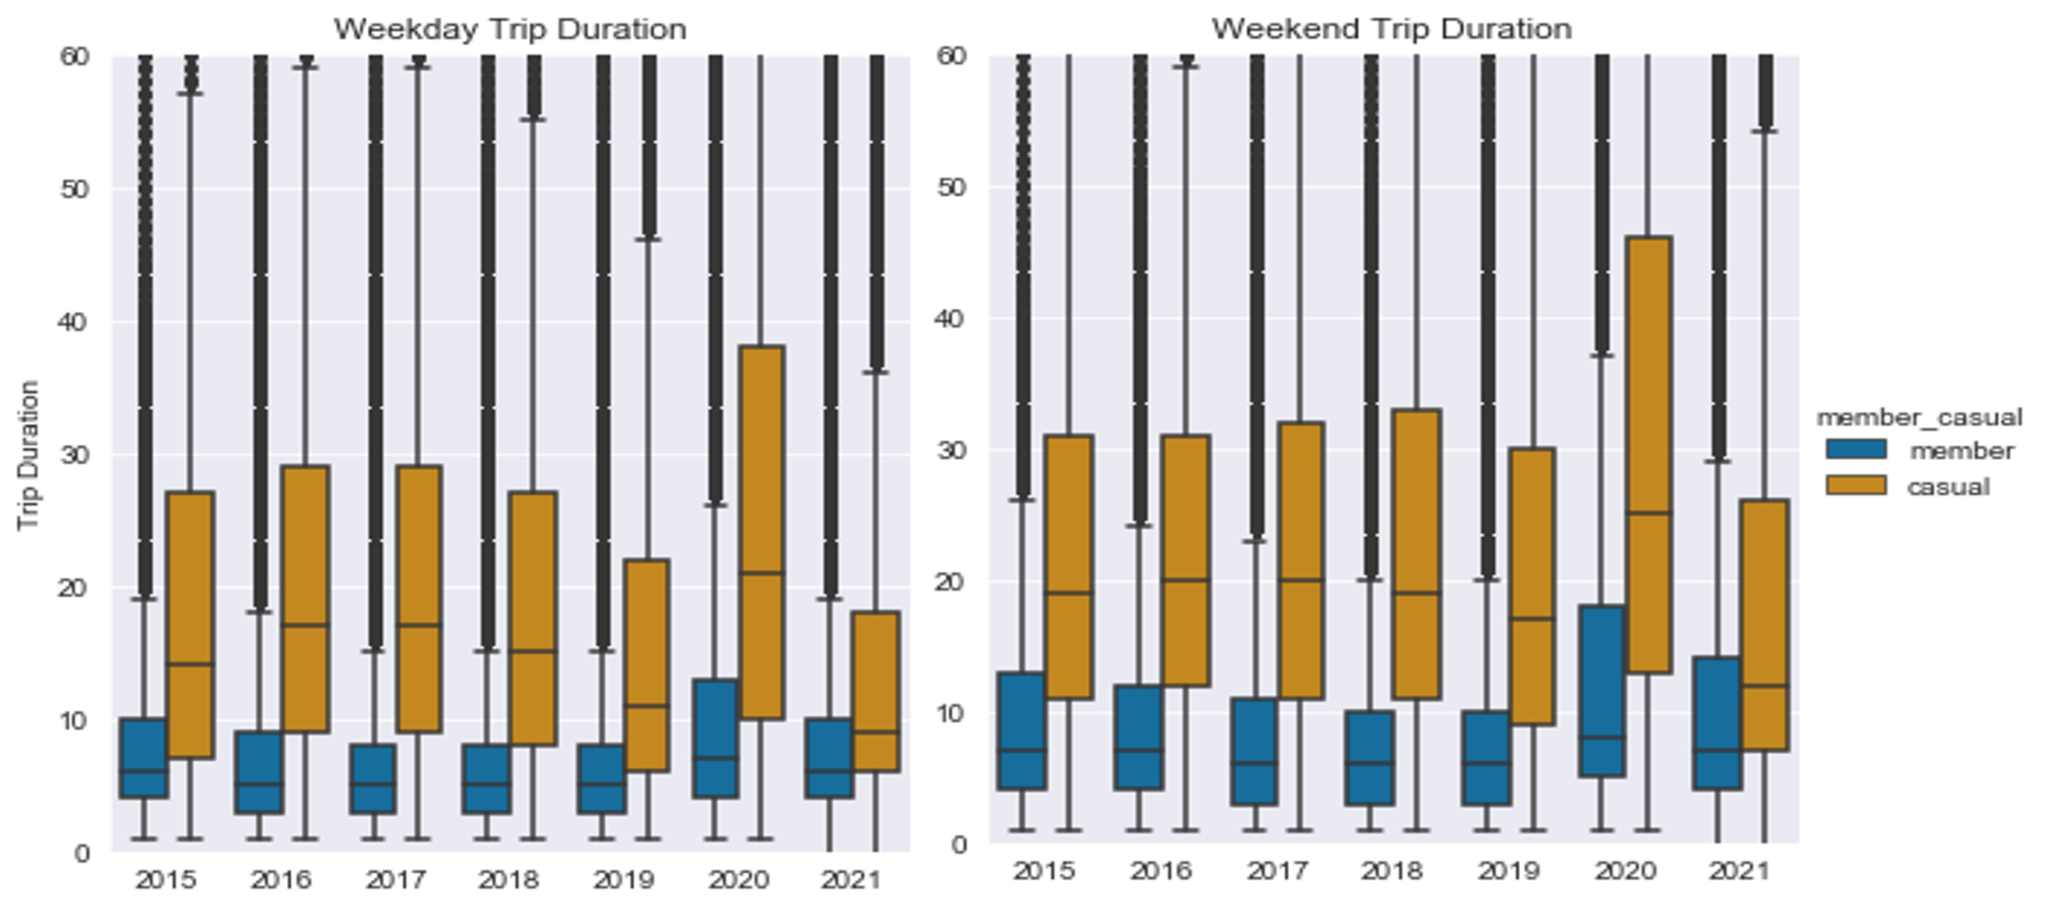
Casual users typically ride bikes much longer than members. Besides 2020, most casual user trips are less than 30 minutes, regardless of whether they occur on weekdays or weekends. Although members have the luxury of having 45 minutes per ride, the majority of the trips by members last only about 10 minutes. Member trips are likely used for commute and connecting to public transportation, while casual user trips tend to be used for leisure or sightseeing activities. Besides 2020, more than half of casual trips are less than 20 minutes. The current pricing structure basically limits a single ride under 30 minutes for casual users [8]. I would say the behavior of members better reflects the real needs of general customers in the JC&H neighborhood. At least on weekdays, a 20-minute trip is enough for most customers, especially in 2021. Considering this neighborhood is much smaller geographically than NYC, a customized pricing rate will definitely encourage the usage. I think $1.99 for each 20-minute, or 15-minute trip is more reasonable in this case. This customized pricing rate will encourage more people to use the bikes for commute. Hybrid work from home with some days at the office each week has become much more common. It makes sense to offer a lower rate for shorter trips to attract the demographic that doesn’t have a daily commute. That will increase the usage and generate additional profit.
3. Reconsider the Least Active Stations
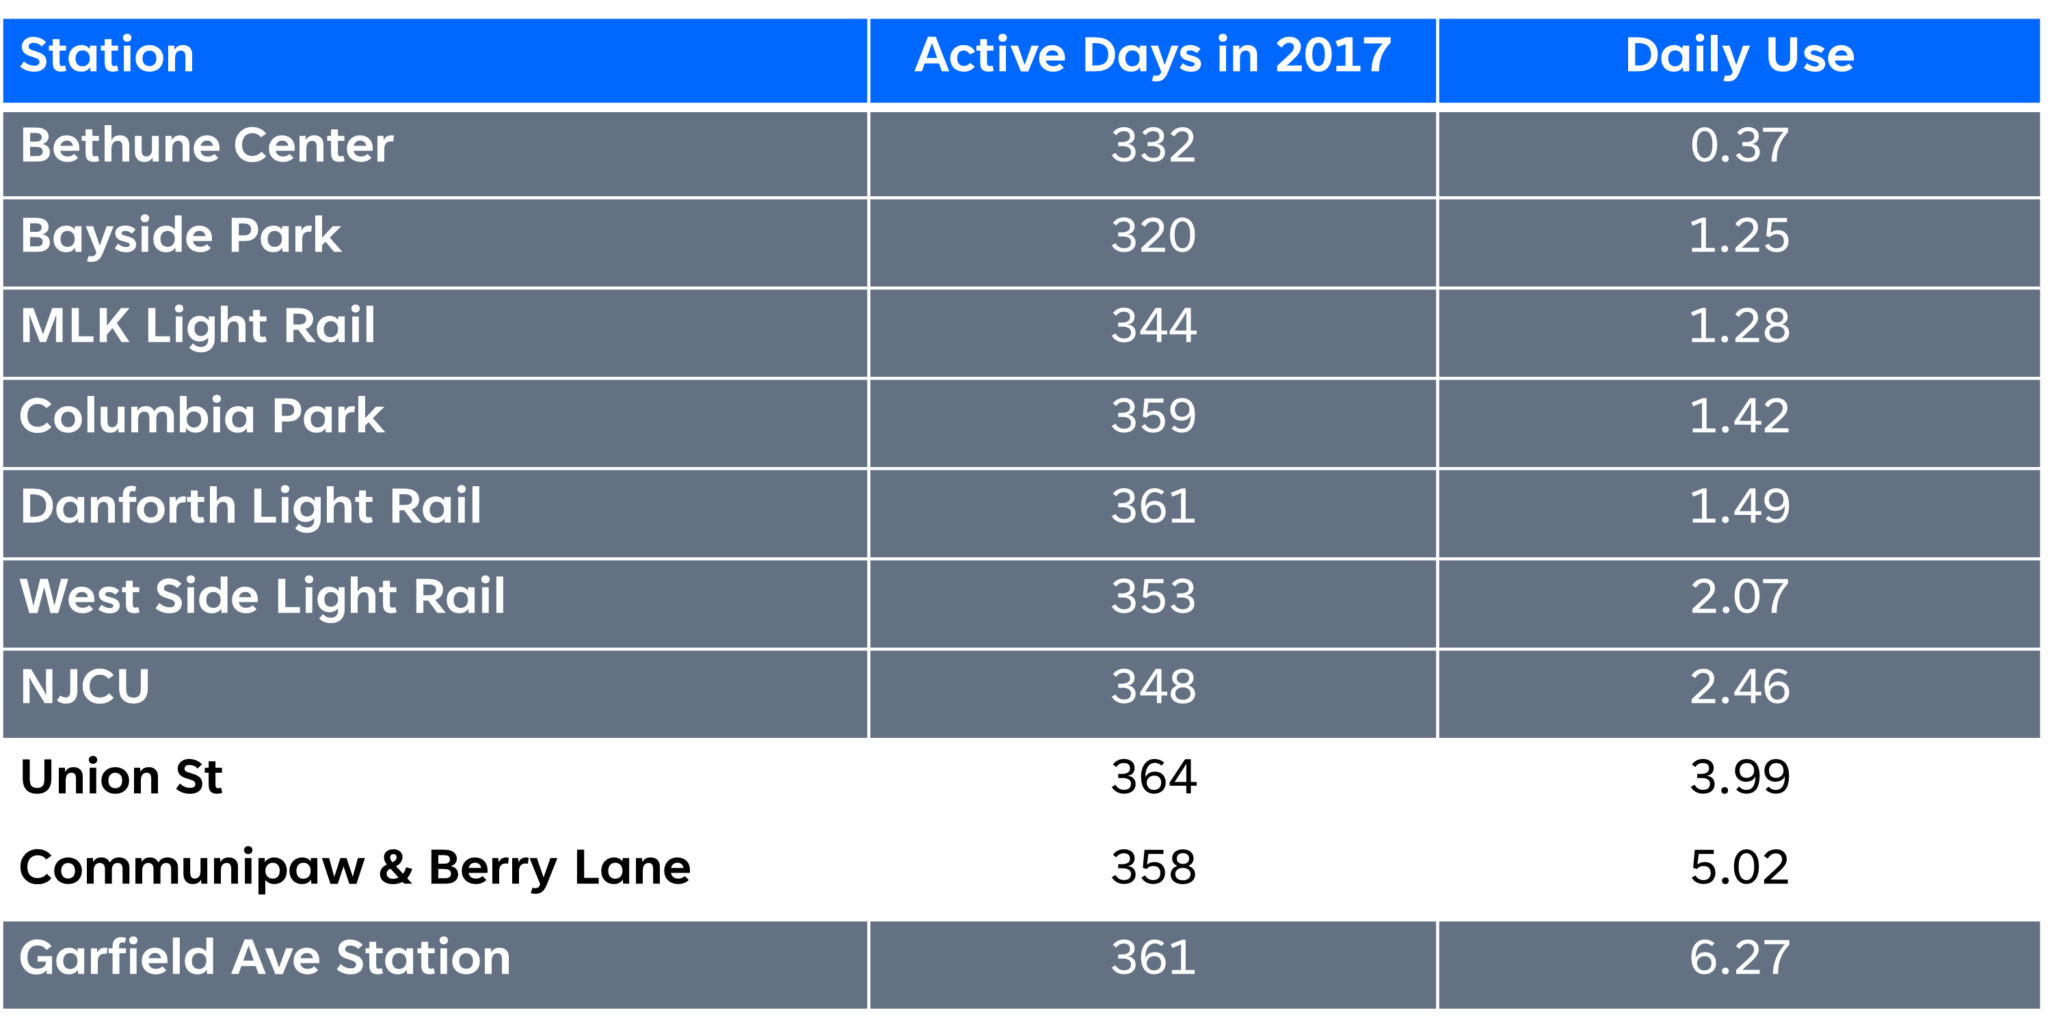
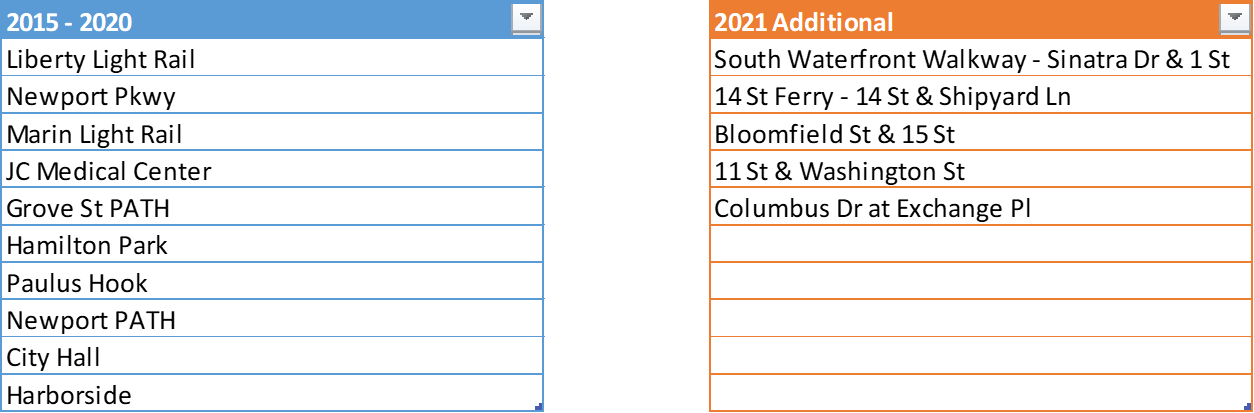
Whereas additional stations were added each year near transportation hubs, residential areas, and business centers, stations were also decommissioned. Especially in 2018, quite a few stations were decommissioned. The 2017 trip history data indicates the stations that were decommissioned were the least active stations. All of them were used less than 7 times a day (either taking or receiving a bike). The table below summarizes the least active stations in 2017; the highlighted ones were decommissioned in 2018.
“Really? Less than 1 time use a day?”
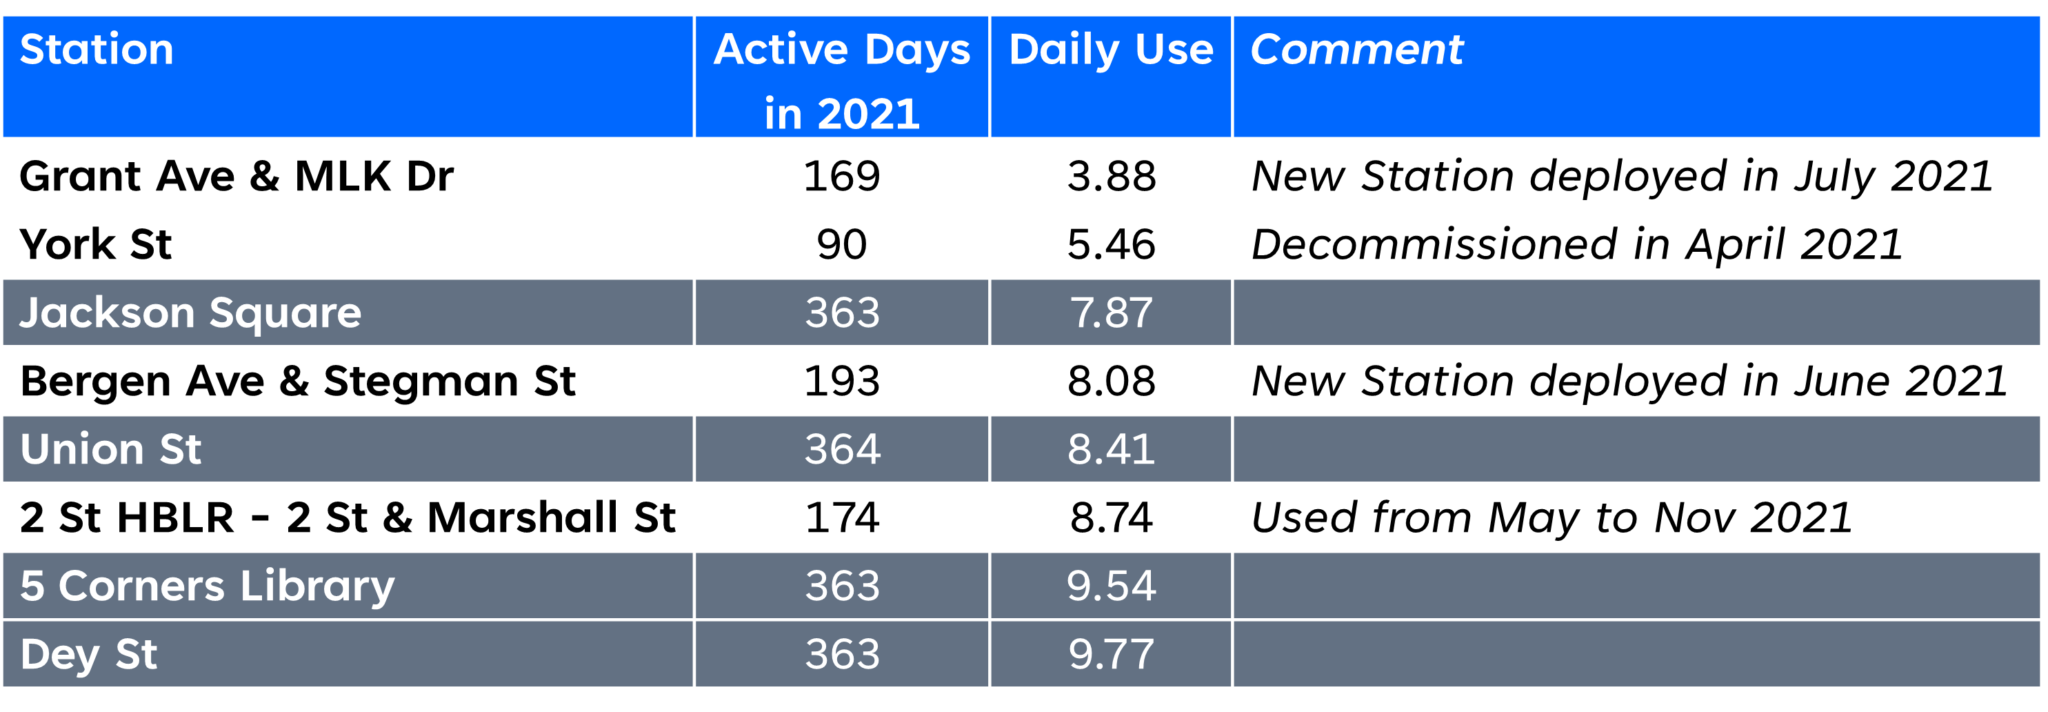
Below are the stations that had fewer than 10 uses per day in 2021. The highlighted stations may be decommissioned in the future.
4. Handle Abnormal Trips
Considering Citi Bike’s pricing structure, any single trip longer than 45 minutes wastes money for responsible users if he/she can find a station to reset the trip. Giving a little buffer, I defined all trips longer than 60 minutes as abnormal. These abnormal trips can be either due to station docker malfunctioning, database maintenance issues, or bikes being lost somehow. Users who see abnormal trips appearing in their accounts usually contact customer service because they mean extra charges or penalties. Taking care of abnormal trips saves Citi Bike operation resource, so special attention shall be given to this issue. The figure below shows clearly abnormal trips skyrocketed in 2020 and 2021. The reason behind it is not entirely clear but worth further investigation.
“Seriously? A trip more than 45 minutes?”

The stations with the most abnormal trips are listed below. These stations should be monitored closely for maintenance issues.
Conclusion
From this dataset with relatively limited variables availability, I was able to extract some interesting business insights. The most interesting finding I think is that the user behavior changed a lot since the pandemic in 2020. Casual users and weekend trips push the Citi Bike usage up to a level that is much higher than pre-pandemic years. Therefore, some actionable items are listed below for Citi Bike operators. Hopefully, by adopting these suggestions, Citi Bike will be more accessible, affordable, and convenient to a more diverse population in Jersey City and Hoboken, making the program more profitable, the community healthier, and the neighborhood greener.
Actionable items:
- Citi Bike shall consider adding bikes in a smaller size or more friendly for female riders or users with variable physical capability.
- Special promotion campaigns or discounts at casual users’ favorite stations should be considered.
- A customized pricing rate shall be considered for JC&H casual users. Instead of using the rate inherited from NYC, $1.99 for every 20-minute or a15-minute trip is more reasonable for this neighborhood.
- Citi Bike shall consider decommissioning the least active stations or moving bikes from these stations to the busiest ones.
- Check the stations that have the most abnormal trips. Malfunctioning dockers should be fixed as soon as possible.
- Please keep up the database maintenance work.
Going Forward
Future works can include the following:
- Compare similar neighborhoods in NYC with JC&H, e.g. somewhere in Brooklyn.
- Combine an external dataset like weather data for more valuable insights.
- Update the station map to display point size by trip counts.
Thank you!
Thank you for taking the time to read about my project! Please let me know if it is insightful and any suggestions or comments you have! Here is my Linkedin.
References
Featured Image - Photo by Uriel Mont from Pexels
- https://www.energy.gov/eere/vehicles/articles/fotw-1212-november-15-2021-high-adoption-shared-micromobility-us-can-save-23
- https://www.researchandmarkets.com/reports/5336156/the-us-shared-micromobility-market-size-trends?utm_source=GNOM&utm_medium=PressRelease&utm_code=j6px8l&utm_campaign=1547863+-+US+Shared+Micromobility+Market+Report+2021-2025+with+Focus+on+Upcoming+Trends+-+Reduction+in+CO2+Emissios%2c++Merger+%26+Partnerships+for+Evolution+%26+Increasing+Adoption+of+Pilot+Programs&utm_exec=chdo54prd
- https://ride.citibikenyc.com/about
- https://citibikenyc.com/nj
- https://nycdatascience.com/blog/student-works/solving-citi-bikes-rebalancing-problem/
- https://ride.citibikenyc.com/system-data
- https://www.chicagotribune.com/lifestyles/chi-to-boost-cycling-make-women-happy-20110726-story.html
- https://citibikenyc.com/pricing